Power Transformer Health Monitoring - Indigenous IoT Platform
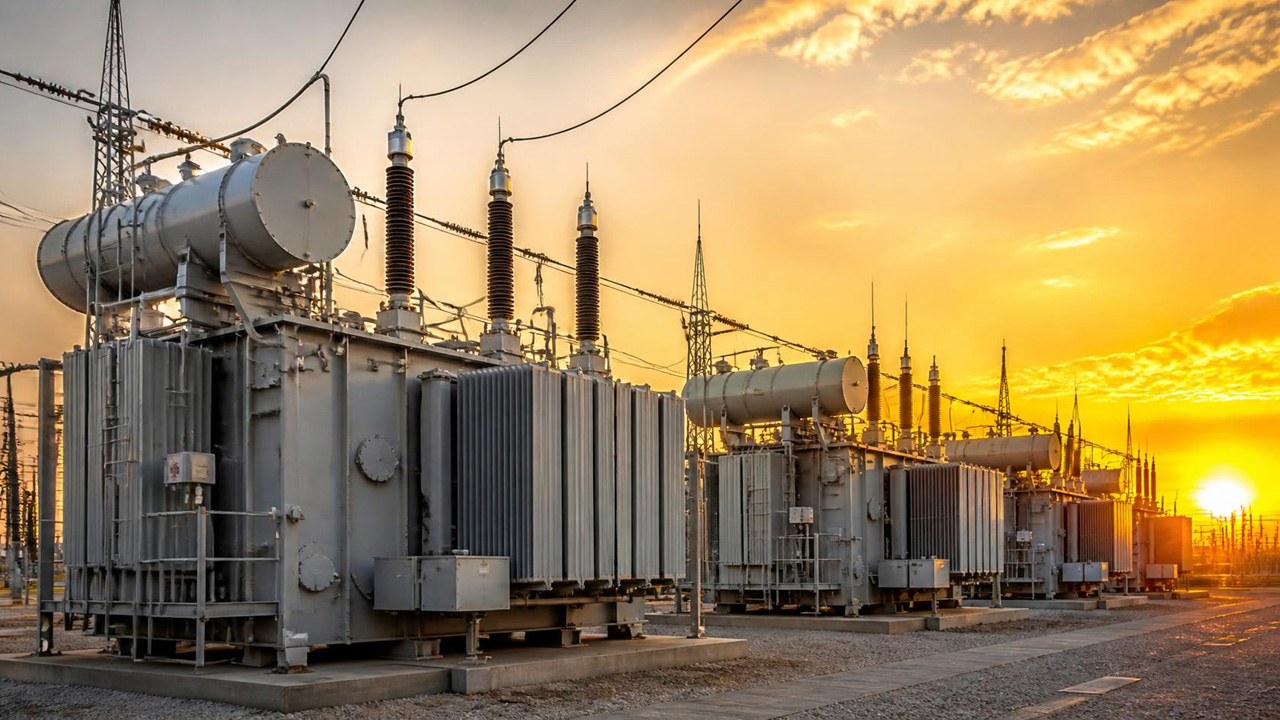
Transform substation operations from reactive maintenance to intelligent, data-driven transformer health management. Our indigenous Power Transformer Health Monitor gives every critical transformer asset continuous visibility — so small deviations never become failures.
A single 25 MVA transformer failure costs Rs. 2-3 crore and takes 8-12 hours to restore, while ageing assets already account for 18% of the installed fleet. Continuous health monitoring is no longer optional — it is essential.
Key Features & Benefits
- Any Make • One Platform: Manufacturer-agnostic fleet health view across ABB, BHEL, CG, Schneider, Siemens, Voltamp or any PTR OEM
- White-Box THI & RUL: Configurable weights, thresholds and transparent health logic you can audit and tune
- Online + Historical Fusion: Live sensor data combined with lab DGA and oil test results, history and relay status
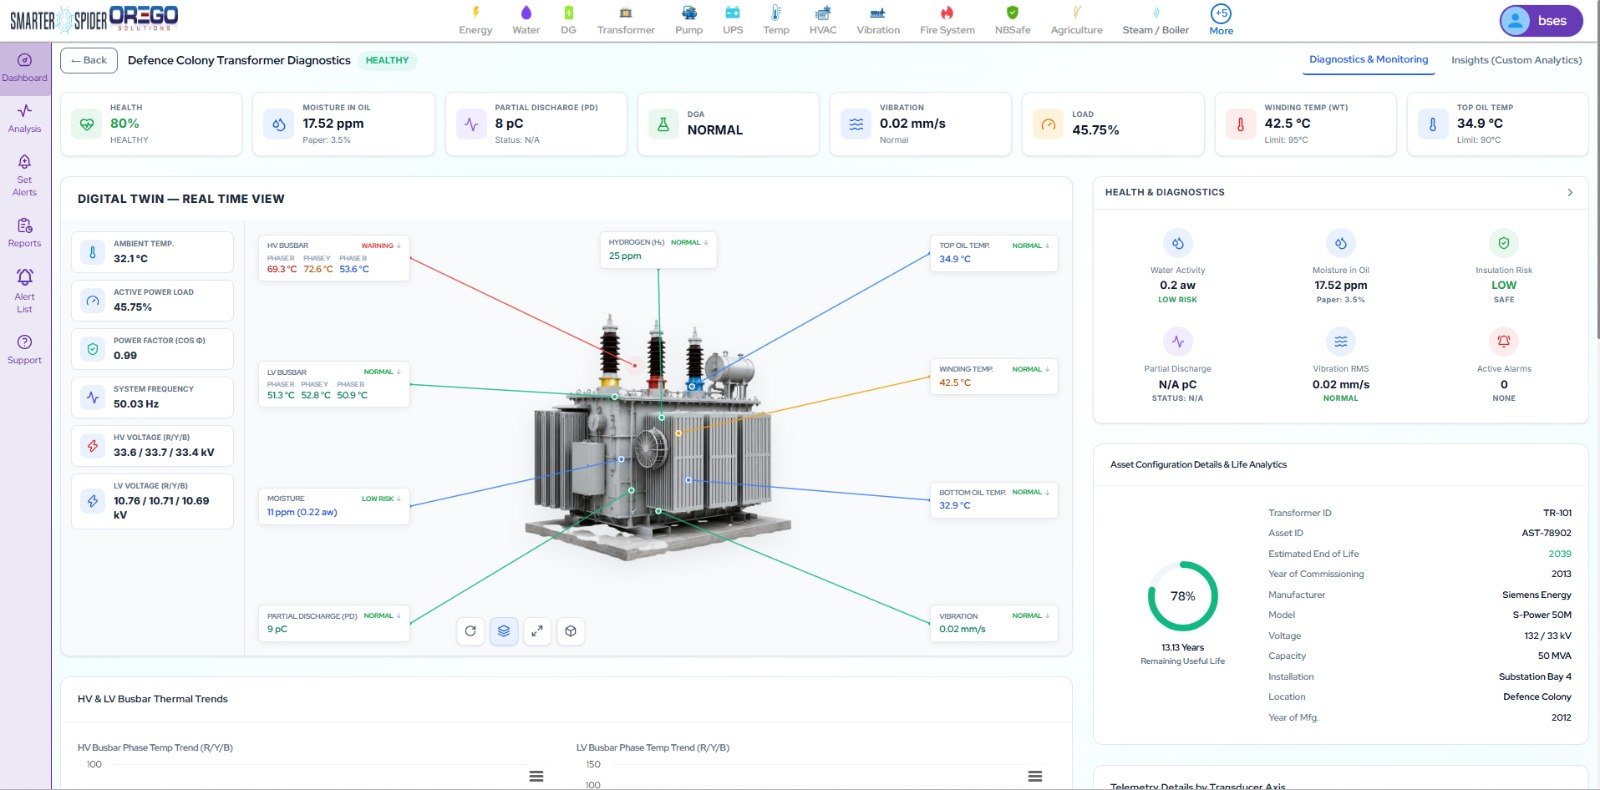
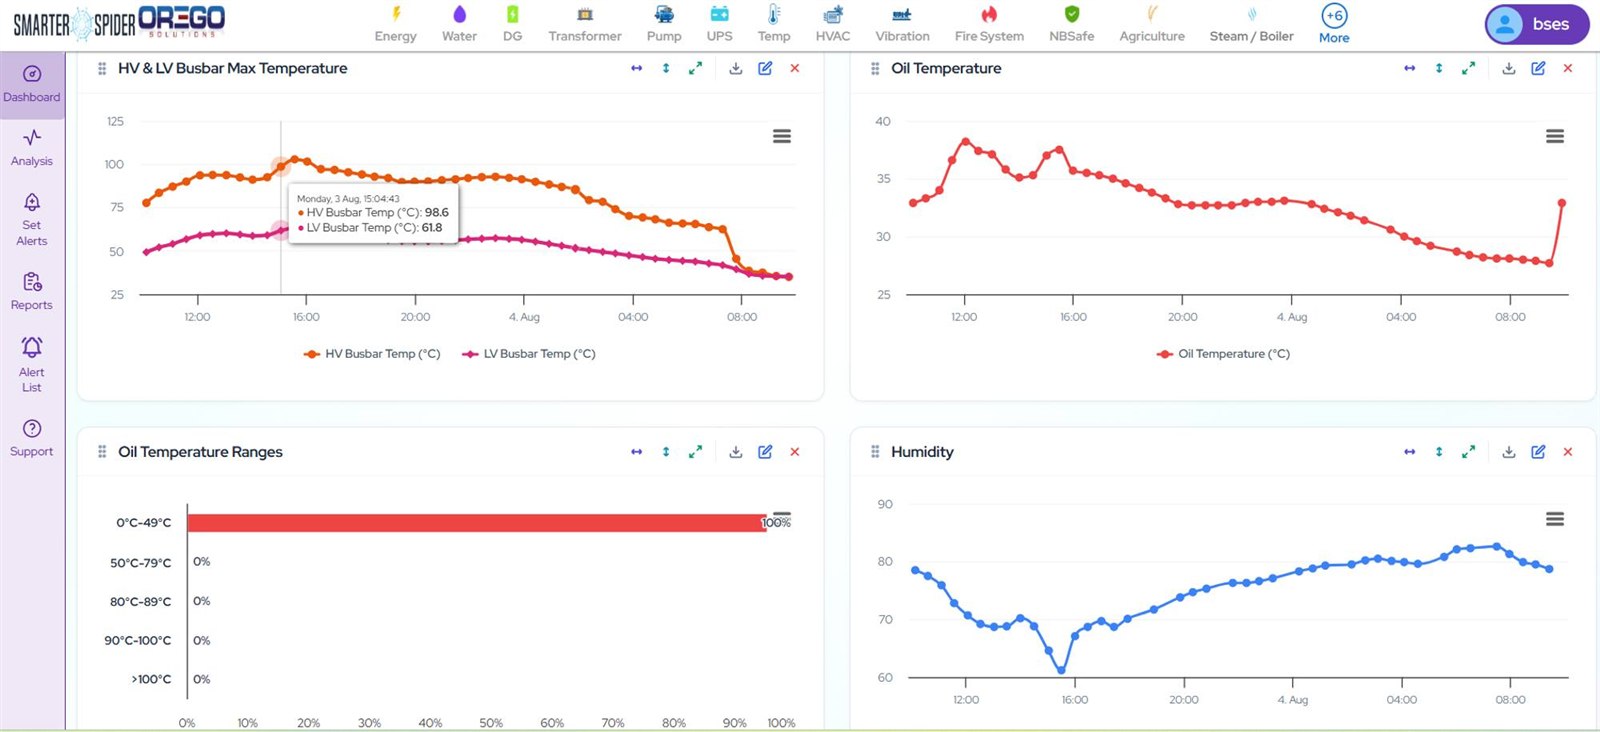
- External Busbar + Vibration: Phase-wise HV and LV busbar temperature with delta-T analysis, plus X/Y/Z vibration trends
- Explainable Health: See exactly why the health score changed and what action to take next
- Fleet Risk Prioritization: Identify which asset needs attention first across your entire substation fleet
- Indigenous & Customisable: Make-in-India platform with local workflows and retrofit-friendly deployment
- Cost Optimisation: Add sensors selectively based on asset risk — lower total cost of ownership
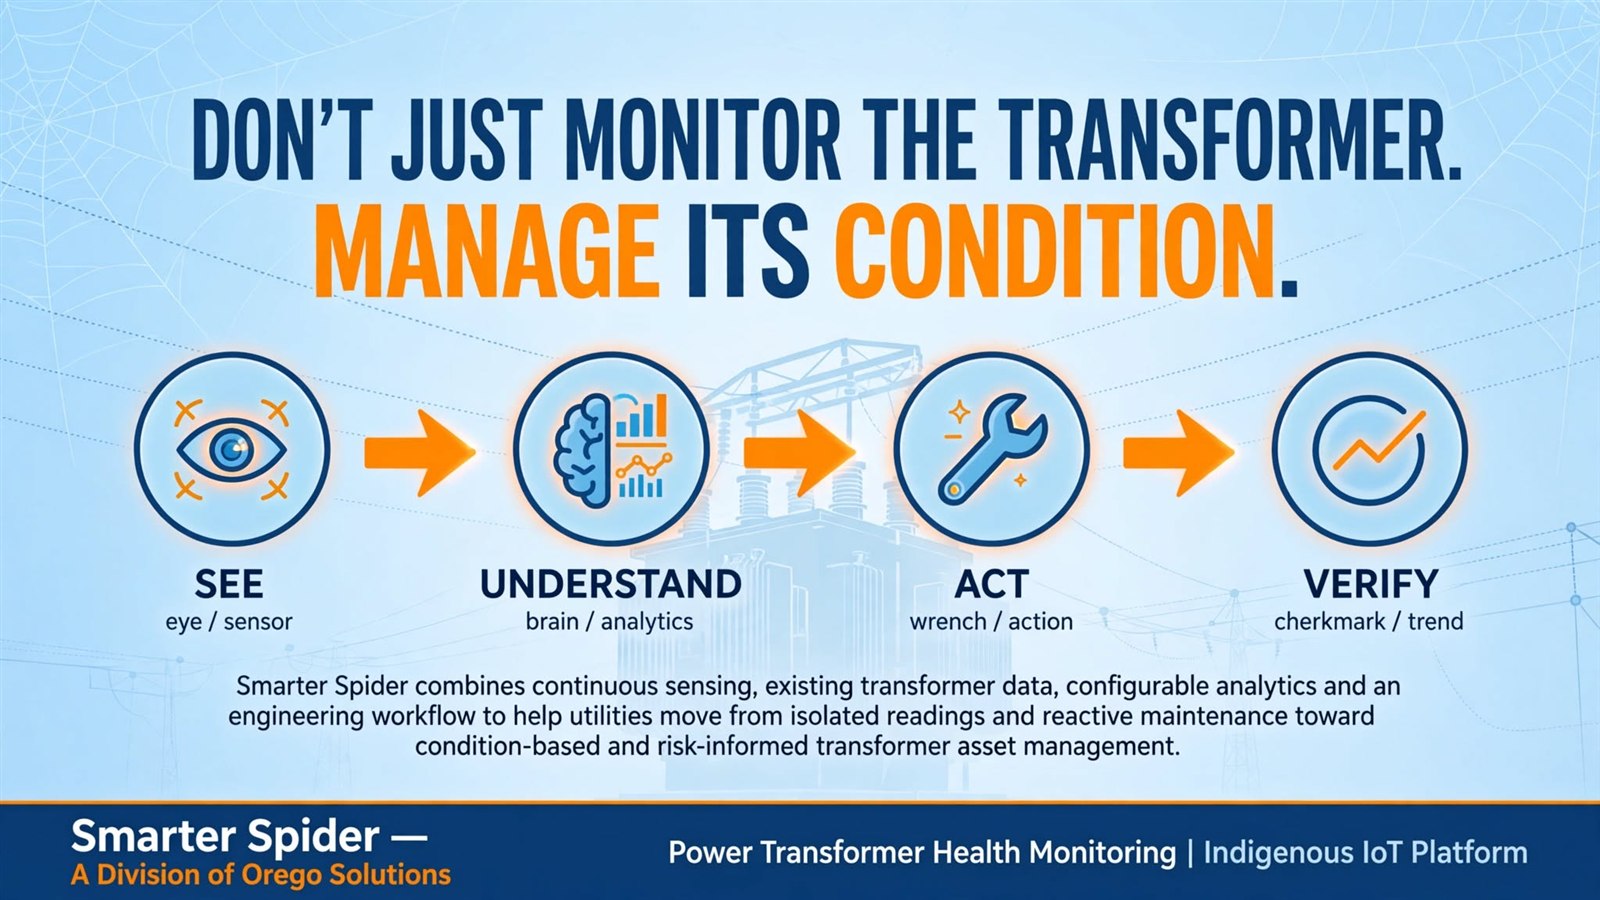
Don't Just Monitor the Transformer - Manage Its Condition
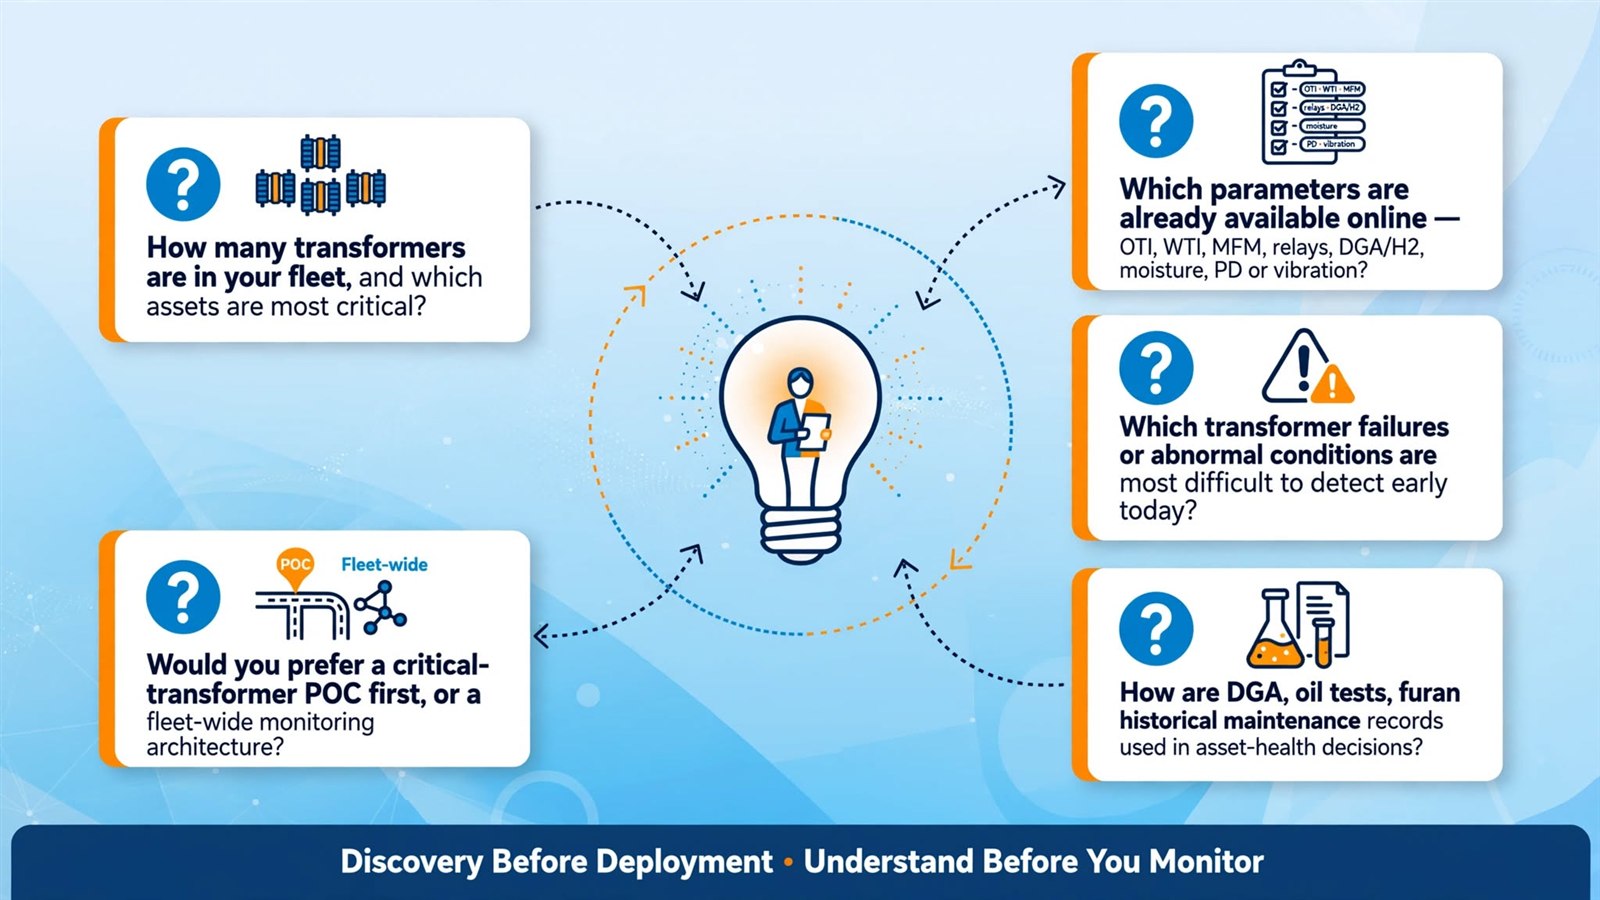
Discovery Before Deployment - Understand Before You Monitor
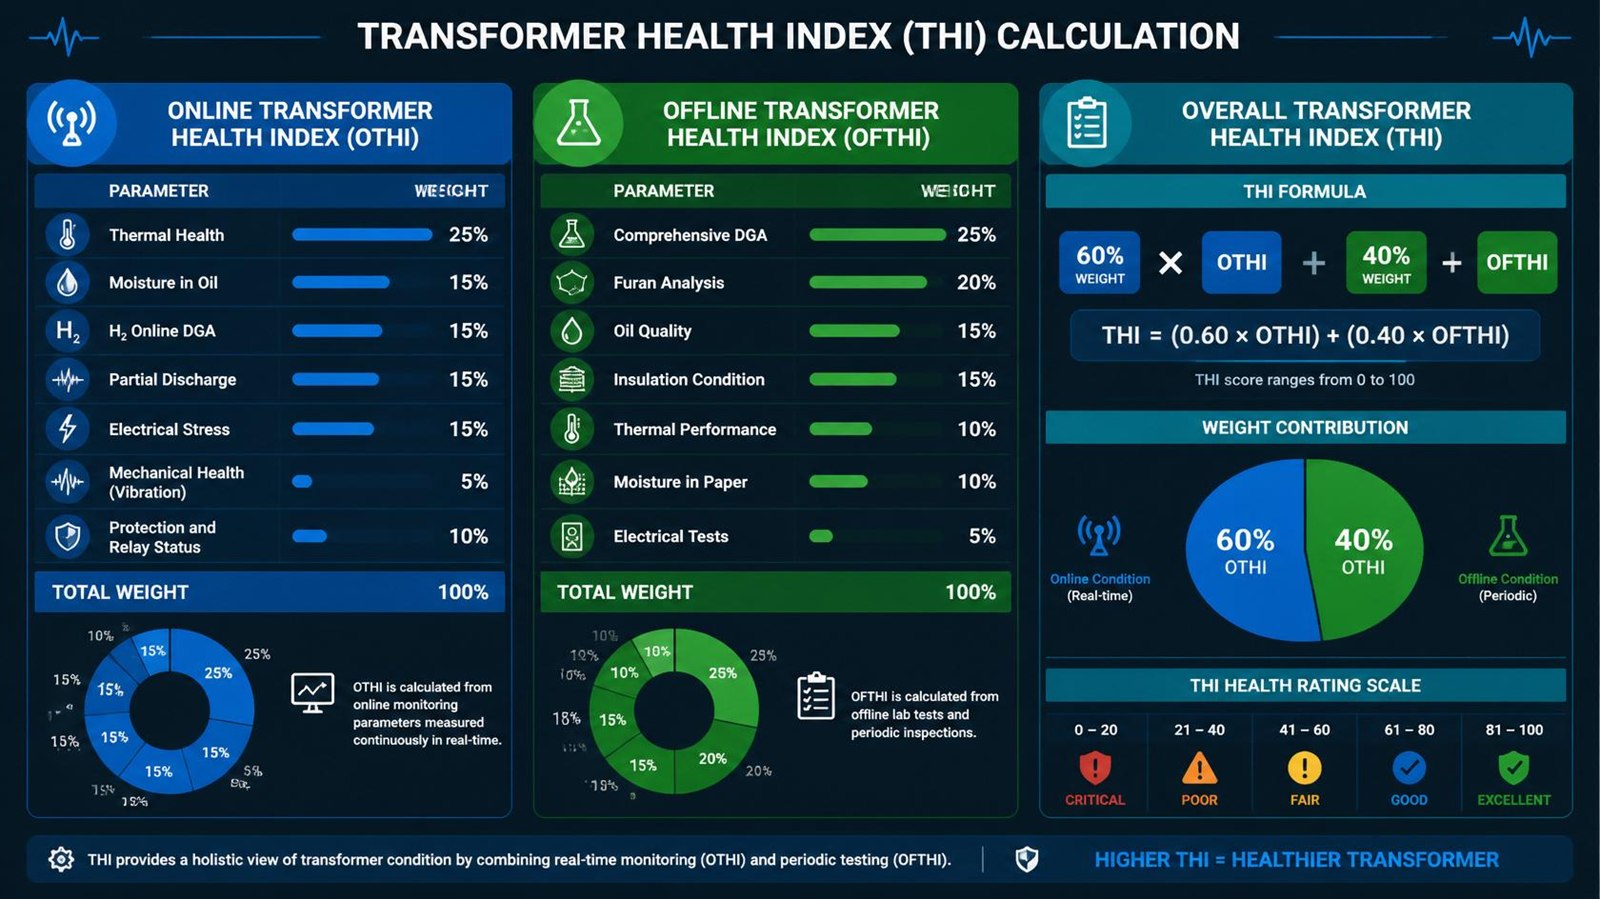
White-Box THI & Remaining Useful Life (RUL)
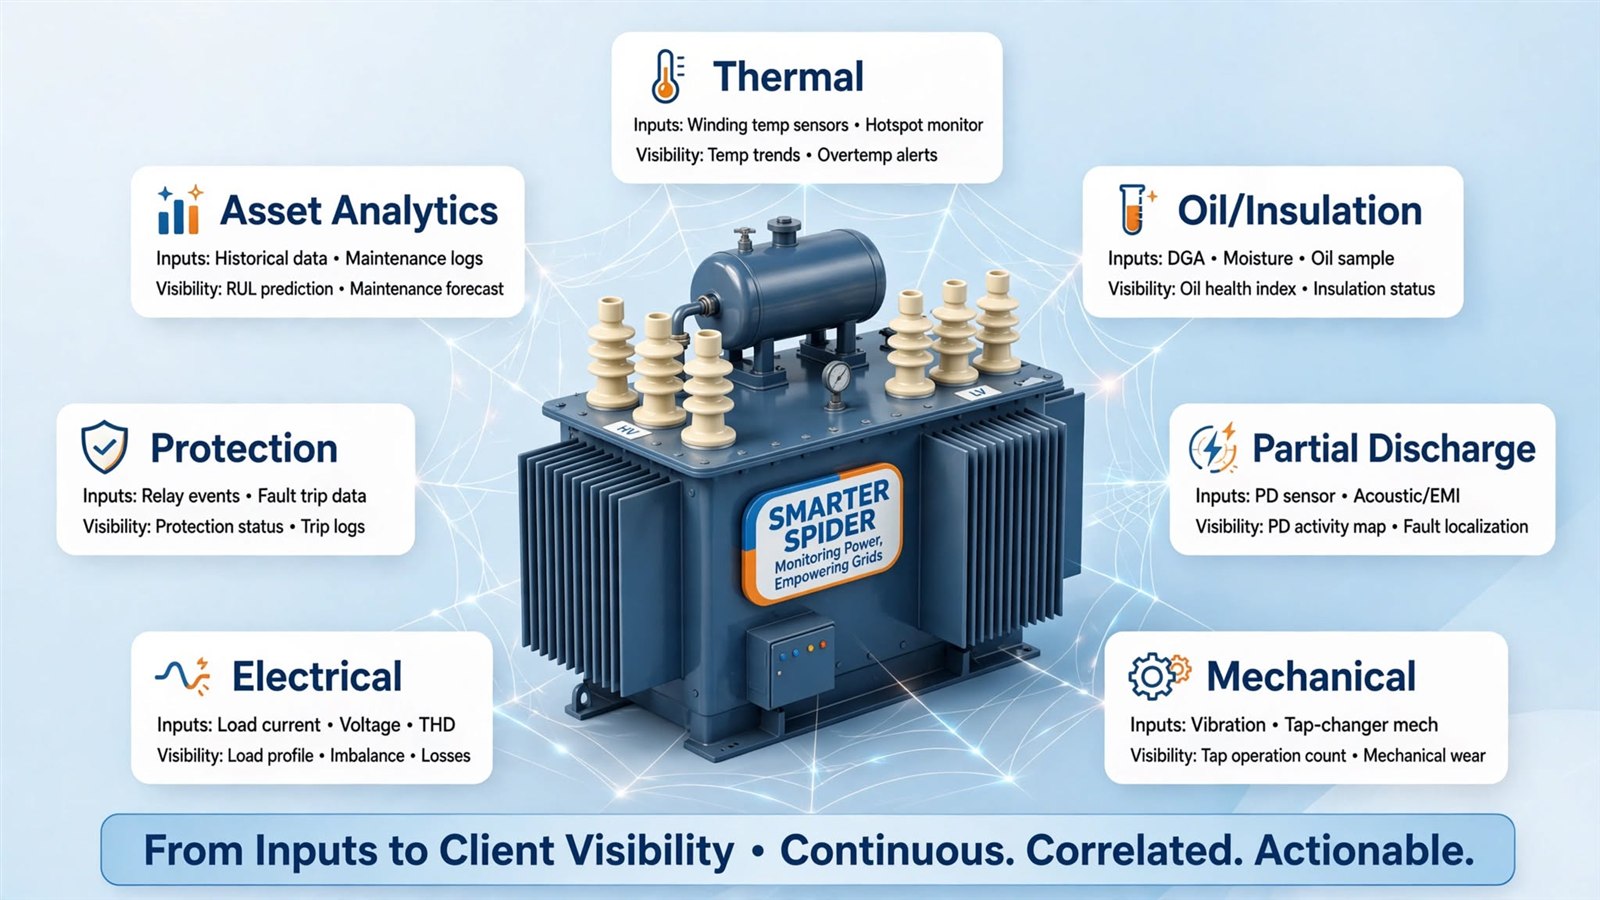
- SEE: Continuous monitoring of oil & winding temperature, phase-wise HV/LV busbar temperature, moisture, dissolved H₂ gas, partial discharge, vibration and relay status
- UNDERSTAND: Analyse online and historical data together to detect abnormal trends and identify the contributors to deterioration
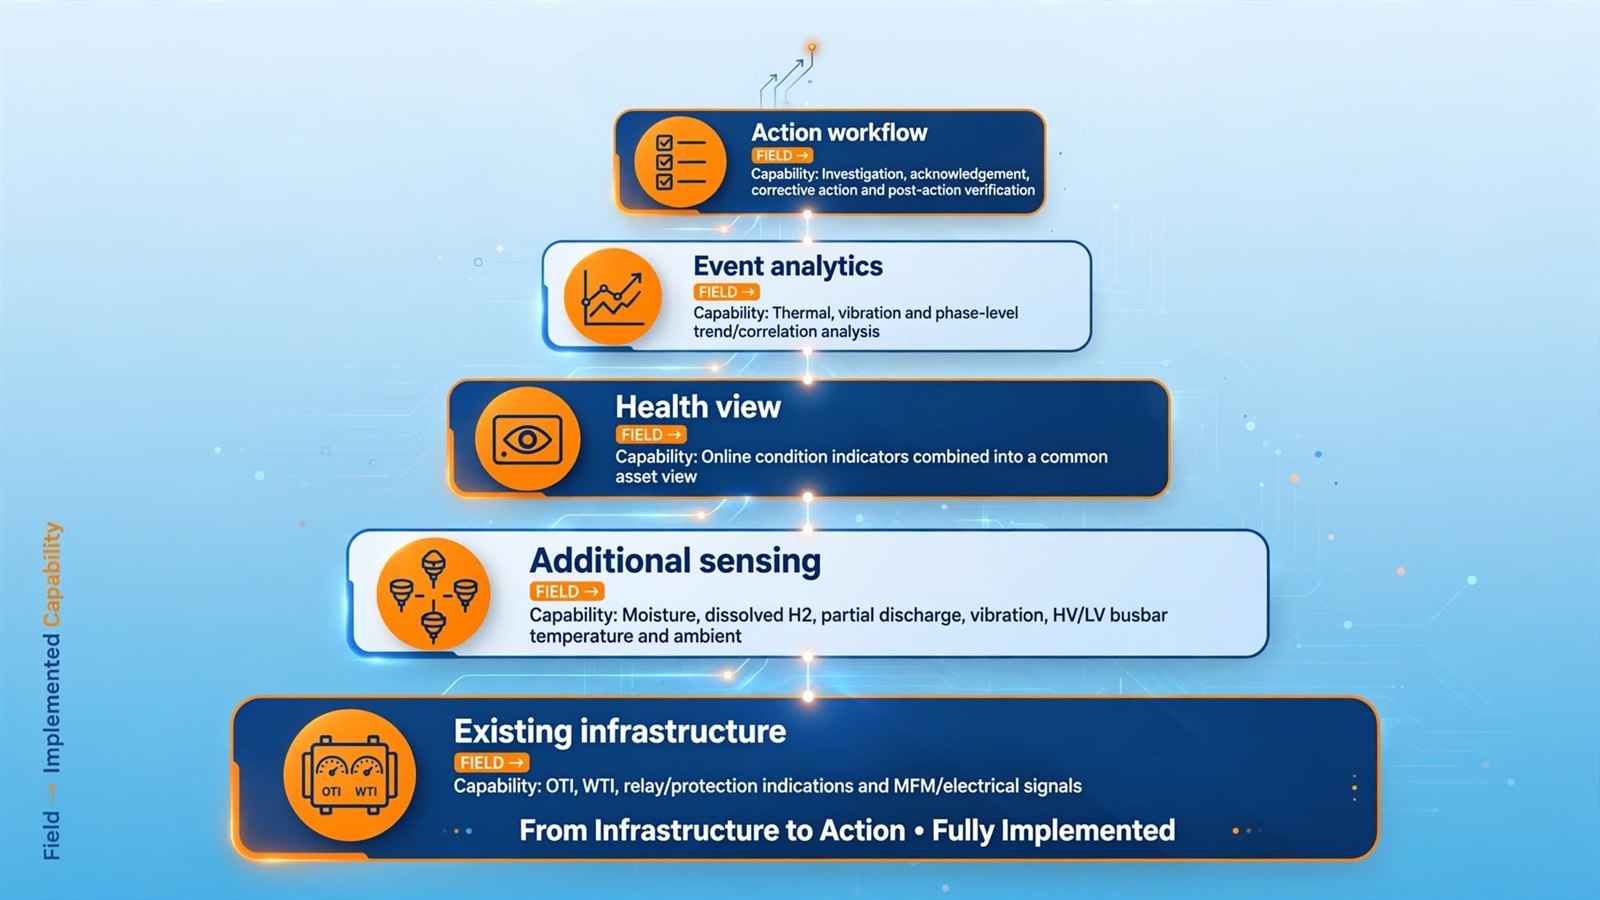
- ACT: Deviation → Risk → Action → Verify — targeted inspection, laboratory oil testing and post-action checks guided by the platform
- VERIFY: Confirm improvement after every intervention for timely action, reduced risk and higher reliability
- Configurable THI: Parameter scores, weights and thresholds tuned to Indian grid operating conditions — not a black box
- RUL Assessment: Plan refurbishment and capital expenditure with predicted remaining useful life per asset
- Fleet Risk Prioritization: Rank assets by risk and value so engineering teams always work on what matters most
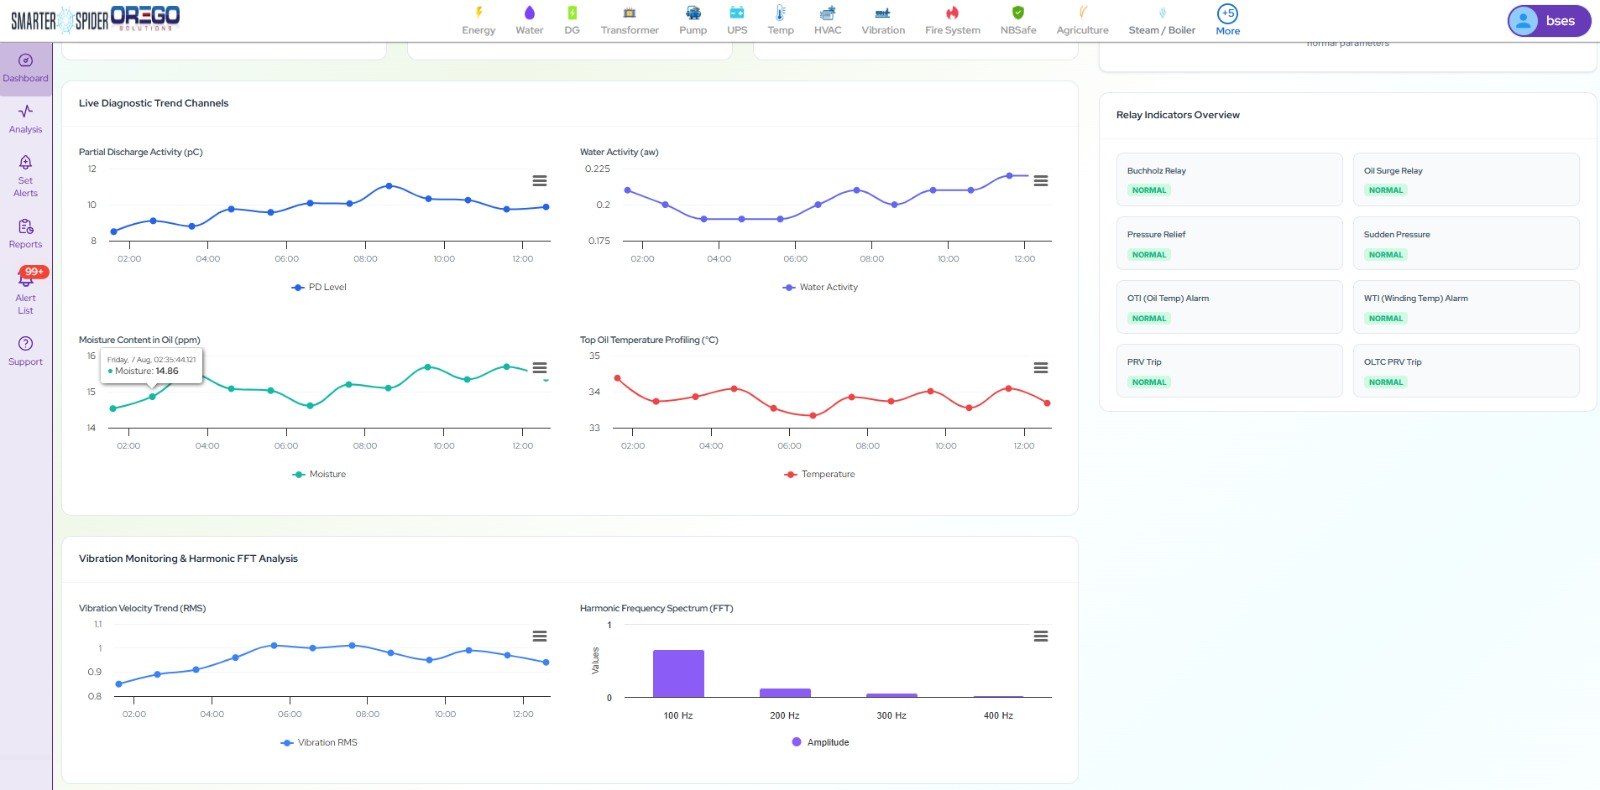
Power Transformer Health Monitor - Live Dashboard
Power Transformer Health Monitor - Busbar & Oil Trends
From Inputs to Client Visibility - Continuous, Correlated, Actionable
From Infrastructure to Action - Fully Implemented
End-to-End Monitoring - From Sensor to Dashboard
- Oil & Winding Temperature
- HV & LV Busbar Temperature (Phase-wise)
- Ambient Temperature & Relative Humidity
- Oil Level, Moisture & Water Activity
- Dissolved H₂ Gas (DGA)
- Voltage, Current, kW / kVA / PF
- Frequency, THD & Energy
- Partial Discharge (UHF / UT / TEV)
- Buchholz, PRD & Oil Surge Relay
- OLTC Trip / Operation & Tap Position
- X / Y / Z Axis Vibration
- Protection & Relay Status
Sensors and existing meters stream over RS485/Modbus to the industrial IoT gateway, then MQTT over TLS to the SSOS cloud — time-series storage, alarm engine, analytics and dashboards with role-based access and multi-channel alerts (WhatsApp, SMS, email and mobile app).
- Multi-brand compatibility: ABB, BHEL, CG, Schneider, Siemens, Voltamp or any PTR OEM
- SCADA ready: REST APIs, OPC-UA, BACnet and Modbus interoperability
- Plug-and-play deployment: scales across 1,000+ substation assets, on-premise with 100% data sovereignty
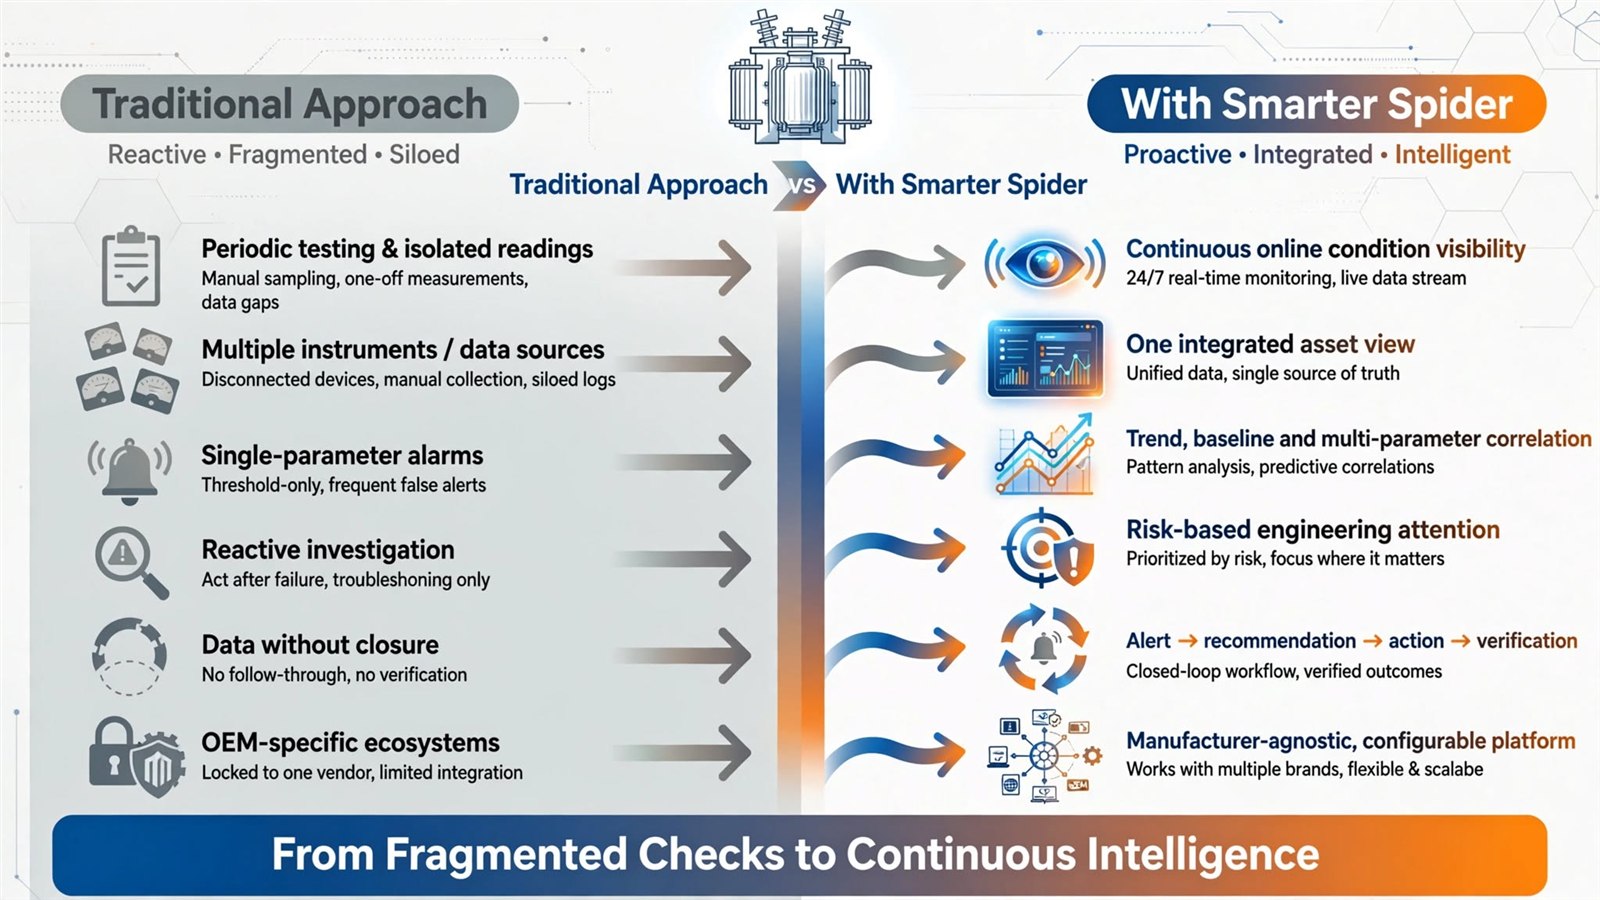
Traditional Approach vs With Smarter Spider
OEM-Locked vs Indigenous - Clear Difference
OEM-Locked Model
- Data stored in a foreign cloud - security risk
- Pay per tag / per transformer / per year
- Black-box analytics that cannot be audited
- Feature requests take 6 months and extra cost
- Only their own brand of transformers supported
- On exit, you lose all historical data
- No customisation for local grid and utility practices
- High false alarms, low trust in alerts
- Dollar-linked licence cost that keeps escalating
Indigenous SSOS Model (POC Proven)
- On-premise or utility cloud - 100% secure
- Unlimited tags, assets and users
- White-box, auditable THI / RUL logic
- New features in weeks from the in-house team
- Any OEM - true multi-brand fleet coverage
- You own the time-series database forever
- Tuned to your grid conditions and alarm logic
- Intelligent filter - no nuisance false alarms
- One-time + AMC rupee pricing model